Multi‑Modal Risk Scoring
Combining diverse data streams – symptoms, images, labs, and text – into a single, accurate risk assessment.
What is Multi‑Modal Risk Scoring?
In a real‑world veterinary triage setting, no single piece of information is enough. A patient may present with symptoms, vital signs, laboratory results, medical images, and even free‑text owner descriptions. Multi‑modal risk scoring fuses all these heterogeneous data types into a unified prediction – for example, the probability of deterioration or the need for intensive care. This approach mimics how expert clinicians integrate diverse clues to make a final judgement.
1. What Data Modalities Are Used?
Structured clinical data – vital signs (heart rate, respiratory rate, temperature), lab results (creatinine, white blood cell count, albumin), and symptom checklists. These are numeric or categorical – easiest to feed into classic machine learning models.
Medical images – radiographs, CT scans, MRIs, and ultrasounds. Computer vision models extract features (e.g., "pneumonia severity" or "fracture probability") that become inputs to the predictor.
Free‑text narratives – owner descriptions, referral notes, or veterinary clinical records. Natural language processing (NLP) turns raw text into structured features (e.g., "mentions of lethargy", "duration of anorexia") or directly embeds sentences into vectors.
Time‑series data – continuous monitoring from ICU devices (heart rate trends, oxygen saturation). Recurrent neural networks or transformers capture dynamic changes that signal deterioration.
Bottom line: Each modality offers a different piece of the puzzle – combining them yields a more accurate risk assessment than any single source alone.
2. How Do We Combine Different Modalities?
Early fusion (feature‑level): Extract features from each modality independently, then concatenate them into one long vector before feeding into a classifier. Simple, but may not capture cross‑modal interactions.
Late fusion (decision‑level): Train a separate model per modality, then average or vote on their outputs. Good for modularity, but ignores correlations between modalities.
Intermediate fusion (hybrid): Use neural networks that combine representations at different layers, allowing the model to learn how one modality should influence another (e.g., image features gate the importance of text).
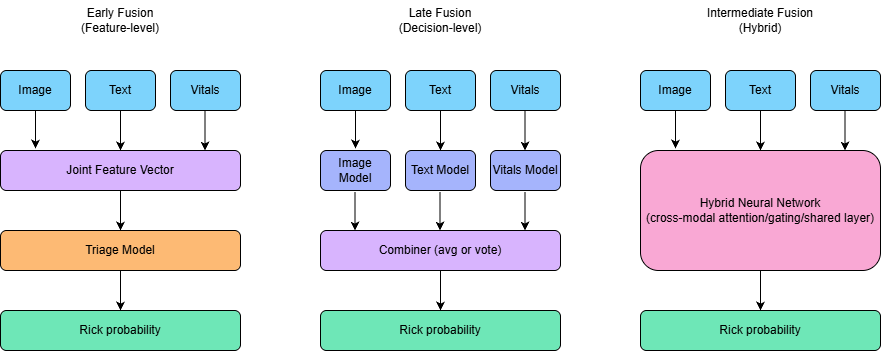 Figure: Three fusion approaches – early (feature‑level), late (decision‑level), and intermediate (hybrid) fusion.
Different clinical situations call for different fusion strategies. Our pipeline adapts by applying the most appropriate method – early, late, or intermediate – based on the data modalities present and the triage task.
3. Common Challenges and How to Address Them
Missing data: Some modalities may not be available (e.g., no diagnostic image taken). Solutions include imputation, using separate models for different input subsets, or designing architectures that can handle missing inputs via masking or attention.
Interpretability: Clinicians need to trust the prediction. Use techniques like SHAP (for tabular data), attention maps (for images and text), or local explanations to show which modalities drove the prediction.
Data alignment: Ensure that data from the same patient at the same time point are correctly matched. Build a robust ETL pipeline that preserves timestamps and patient IDs.
Bottom line: Real‑world clinical data is messy – building a robust multi‑modal system requires careful engineering around missing data, explainability, and alignment.