Machine Learning Classifiers
How supervised learning algorithms help distinguish between diseases based on symptom patterns.
What are Machine Learning Classifiers?
A classifier is a machine learning model that assigns a label to an input based on learned patterns. In a triage system, classifiers take a patient's symptoms (e.g., fever, lethargy) and output the most likely disease(s).
1. Common Classifier Families – Matching Models to Scenarios
No single classifier works best for every triage scenario. The right choice depends on dataset size, interpretability needs, and the urgency of the condition. Below are the classifier families we use.
Logistic Regression
A linear model for binary classification (disease present/absent). It outputs a probability between 0 and 1 using an S‑shaped function. The learned coefficients directly indicate how much each symptom influences the risk.
By adding polynomial features (e.g., temperature², WBC²), it can capture “sweet‑spot” patterns – for instance, a disease most likely when a lab value is moderately elevated. This creates curved, elliptical decision boundaries like the one in the figure.
Logistic regression is interpretable, requires little data, and runs fast – ideal for real‑time triage.
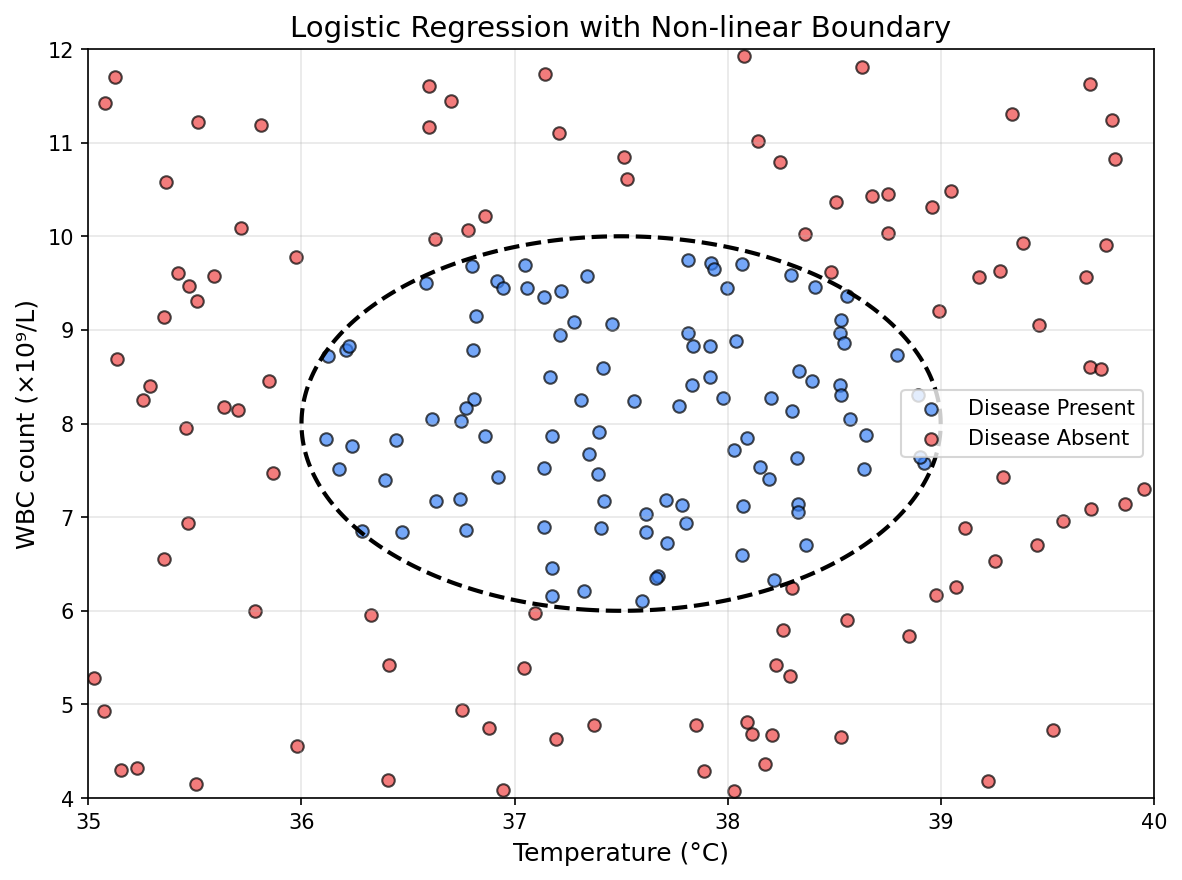 Figure: Logistic regression with quadratic features creates an elliptical boundary – disease present (blue) inside.
Decision Trees & Random Forests
A decision tree asks a series of yes/no questions about symptoms (e.g., “temperature higher than 39°C?”). The leaves contain the final diagnosis – highly interpretable.
However, a single tree is brittle and overfits. Random forests build many trees on different data subsets (bagging) and vote on the final prediction. This reduces variance and improves accuracy.
Random forests also provide feature importance – telling clinicians which symptoms mattered most.
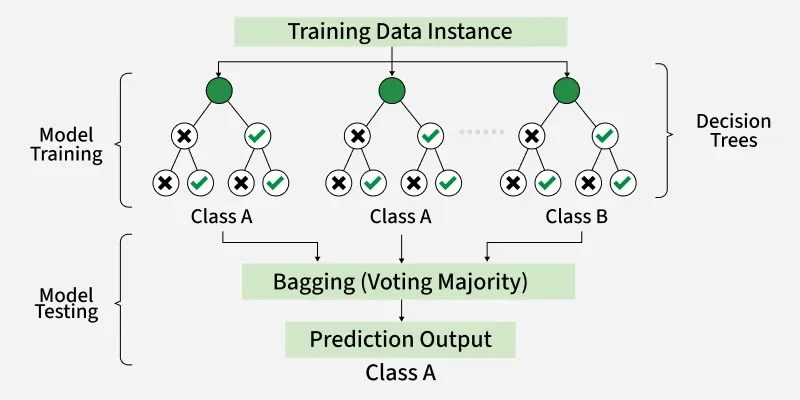 Figure: A decision tree splits symptoms into branches to reach a diagnosis.
Support Vector Machines (SVM)
SVM finds the optimal separating boundary (hyperplane) between disease classes. The support vectors are the closest points to the boundary – they define its position.
SVM focuses on maximising the margin, which improves generalisation. The kernel trick maps symptoms into higher dimensions, allowing non‑linear boundaries without extra computation.
Works well when the number of symptoms is large relative to patient records (e.g., CBC profiles). Memory efficient (stores only support vectors), but does not naturally output probabilities.
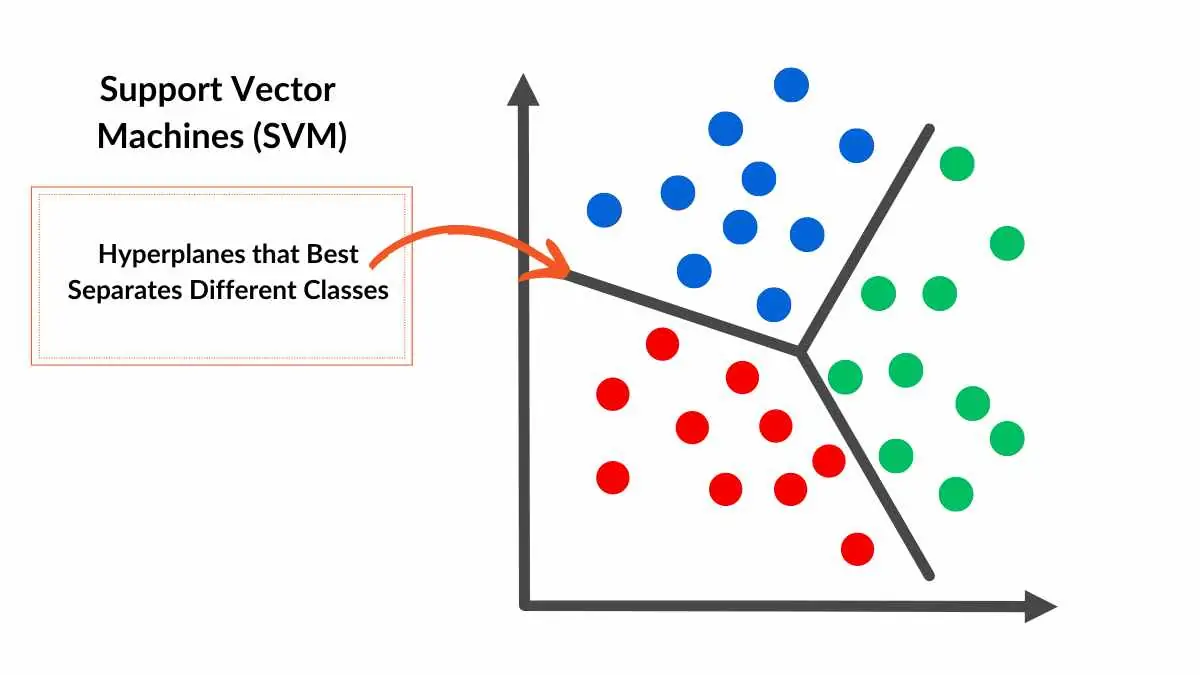 Figure: SVM finds the widest possible margin between disease classes.
Neural Networks
Neural networks consist of layers of interconnected “neurons”. The input layer receives symptoms, hidden layers learn hierarchical features, and the output layer gives disease probabilities.
They excel with large labelled datasets (thousands of records) and can discover subtle, non‑linear interactions that simpler models miss.
Challenges: “black box” (hard to explain), careful tuning of many hyperparameters, and computational cost. Reserve for cases where simpler models are insufficient and data is abundant.
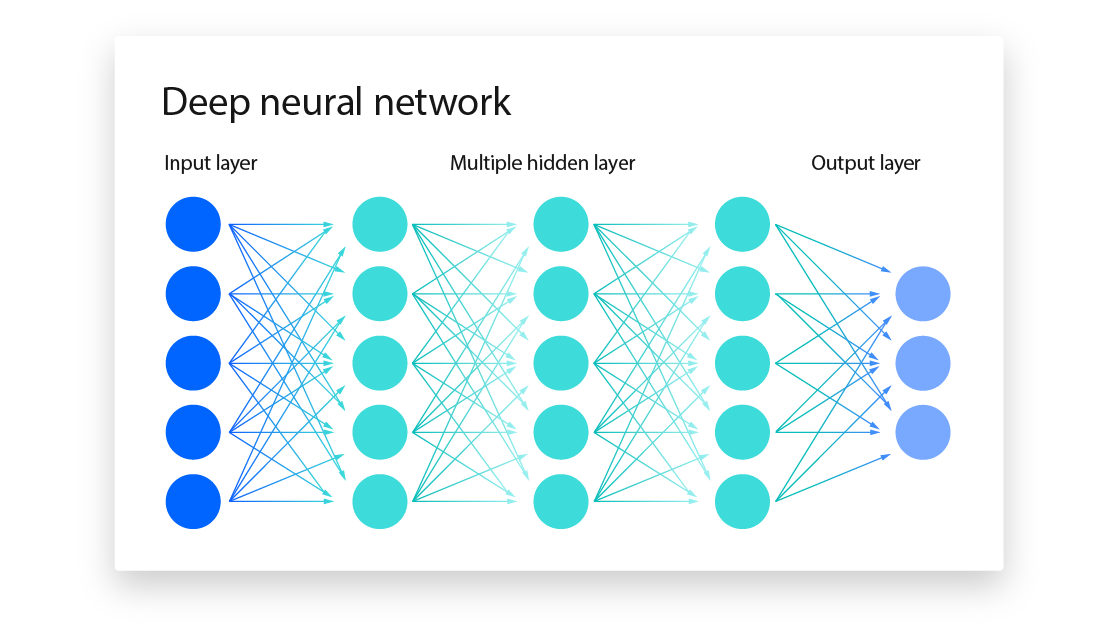 Figure: A neural network with one hidden layer learns non‑linear patterns.
2. How Classifiers Are Trained
Training requires a labelled dataset – many patient examples with known symptoms and correct disease. We split the data into three distinct subsets:
• Training set (60‑80%)
The model learns internal parameters (coefficients, split points) to minimise prediction errors.
• Validation set (10‑20%)
Used to tune hyperparameters (e.g., tree depth, regularisation strength) – the model never sees the answers during training.
• Test set (10‑20%)
Locked away until the end. Run the model exactly once to get an unbiased estimate of real‑world performance.
A well‑trained classifier generalises – it correctly predicts diseases for symptoms it has never seen. This three‑way split prevents overfitting (memorising the training data) and ensures reliable deployment.
Bottom line: Training set teaches, validation set tunes, test set gives an honest final score.
3. Key Performance Metrics
When comparing classifiers, we look at several metrics. Most important in triage: precision (avoid false alarms) and recall (avoid missing dangerous diseases).
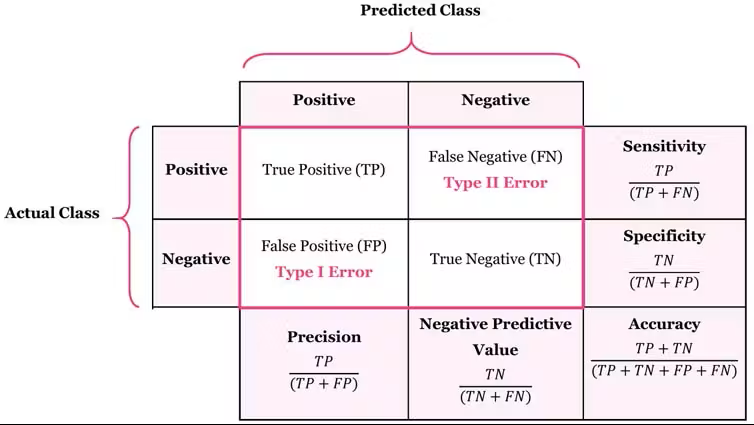 Figure: Confusion matrix with calculation formulas.
The confusion matrix above gives us the raw counts and basic formulas. The table below explains what each metric means for triage, and includes the F1 Score – a useful combination of precision and recall.
| Metric | What it measures | Why it matters in triage |
|---|---|---|
| Accuracy | Fraction of correct predictions (overall). | Good for balanced datasets, but misleading if one disease is rare. |
| Precision | When the model says “disease present”, how often is it correct? | Avoid false alarms (over‑triage) and unnecessary treatment. |
| Recall (Sensitivity) | Of all actual disease cases, how many did the model successfully catch? | Critical for dangerous diseases – missing a case is worse than a false alarm. |
| F1 Score | Harmonic mean of precision and recall. | Balanced measure, especially with imbalanced diseases. |
Bottom line: For triage, recall is often prioritised over precision – but the right balance depends on the specific disease and clinical context.